I’ve been side-tracked by a project to generate fairly complex multi-thousand page reports. Python and ReportLab are my go-to standards for this type of project.
I needed to create a plugin for the ReportLab RML templating language to render dynamic Matplotlib charts.
This is my first time using the commercial ReportLab project which uses a templating language (RML).
The templating language has a <plugInFlowable /> element which calls back into the Python code.
I found several examples of creating a plugInFlowable but none that worked with the RML templating.
After reading through the excellent Stackoverflow
discussion and taking a long contemplative walk, I figured out the solution.
As with all solutions, it is extremely simple.
The hard part is finding the simple solution.
The sample code is available in a GitHub repository.
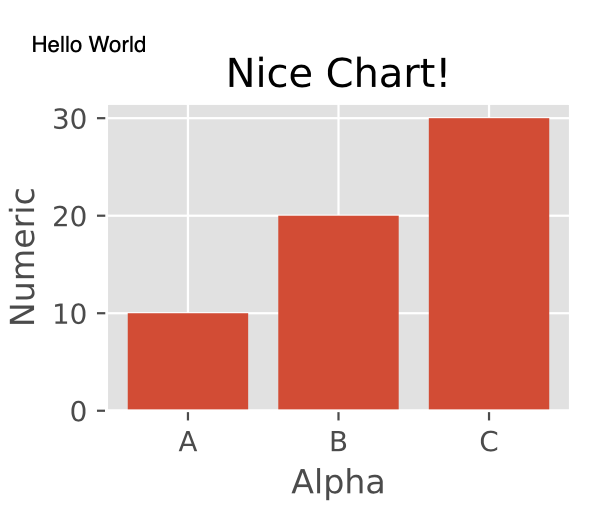
Screenshot of a simple Matplotlib chart rendered within a PDF page:
